I’ll collect here some useful patent and copyright graphics that I come across. Feel free to send others to me.
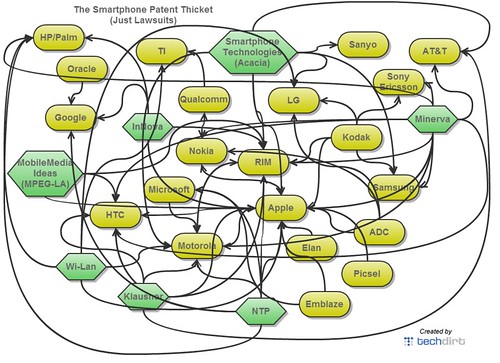
See this amazing FT Graphic Illustrating the Smartphone Patent Wars.
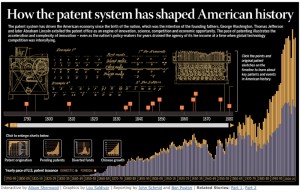
Also, from Interactive Graphic Pretends to Illustrate How U.S. Patent System Has Driven American Economy:
From Motorola: Enemy or Friend of Google?:
From Patent Wars: A New Age of Competition [INFOGRAPHIC]:

From: Web of Tech Patent Lawsuits [INFOGRAPHIC]:
From Droid Life (via PCMag):
Web of Tech Patent Lawsuits [Infographic]
by: Tim-o-tato | posted 01.24.12 | News
It seems every other day that we hear Company A is suing Company B over patent infringement. Thanks to PCMag, we can keep track of them all through a set of infographics. These graphs give us a solid representation of the amount of firepower each company holds with their number of patents. As we can see, a lot of these companies have in the tens of thousands of patents – how they keep track of them all, don’t ask us. In the above chart, there are the major filings along with their dates, but we sort of wish they also had the outcome. We love a good Fortune 500 drama, but can’t we all just get along?

Via: PCMag
From Infographic: What is the Stop Online Piracy Act, and why should I care?:
Great infographic explaining the hideous, evil Stop Online Piracy Act, aka SOPA, linked in a post at The Sociable.
h/t Denise Howell @ TWiL 146.

From MPAA Copyright & Content “Theft” Propaganda:
From Scribd:
mpaa-infographic


You must log in to post a comment. Log in now.